Traffic Analysis
The traffic views show what clients are doing in real time. They are useful for diagnostics, reverse engineering polling behavior, and validating client integrations.
Clients
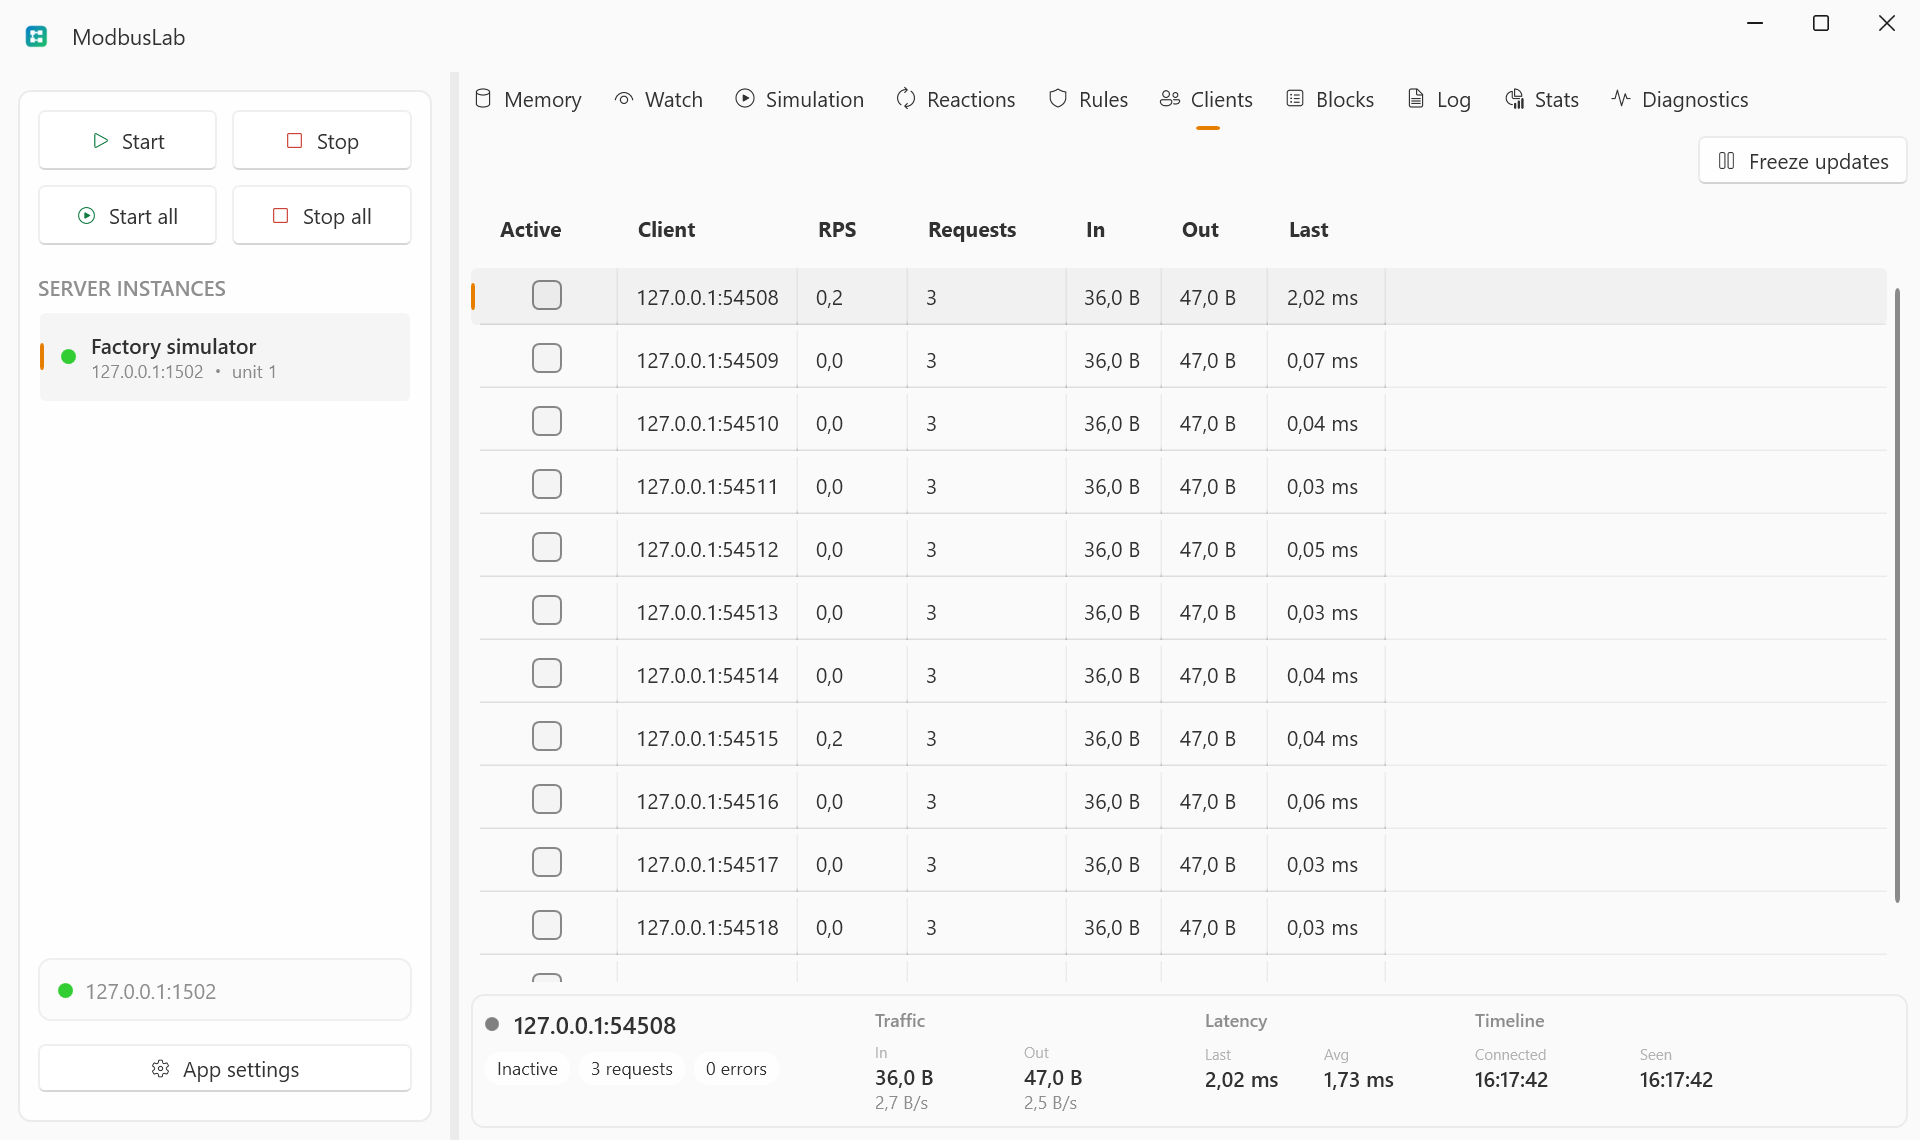
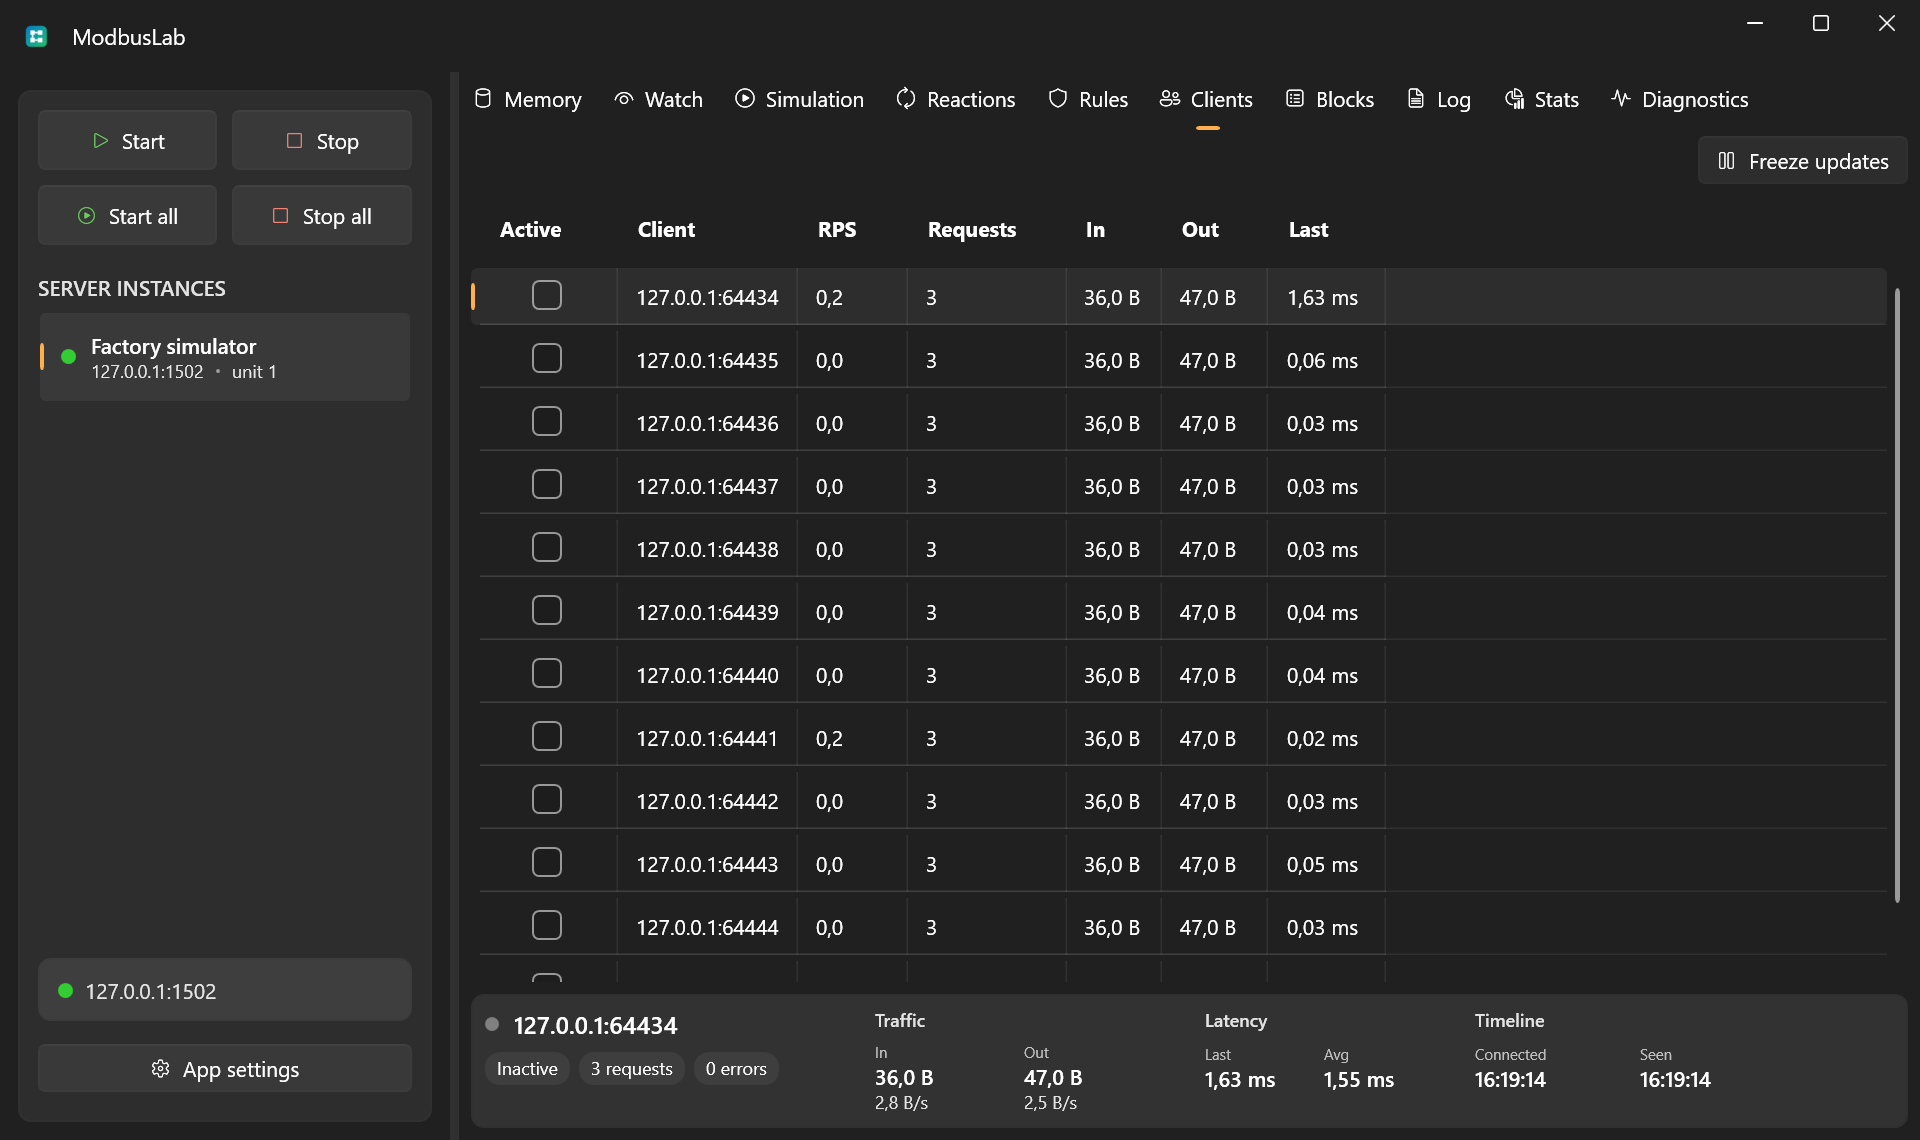
The Clients view lists connected and recently disconnected clients.
It shows request counts, error counts, bytes in/out, request rate, latency, connection time, and last activity summary.
Blocks
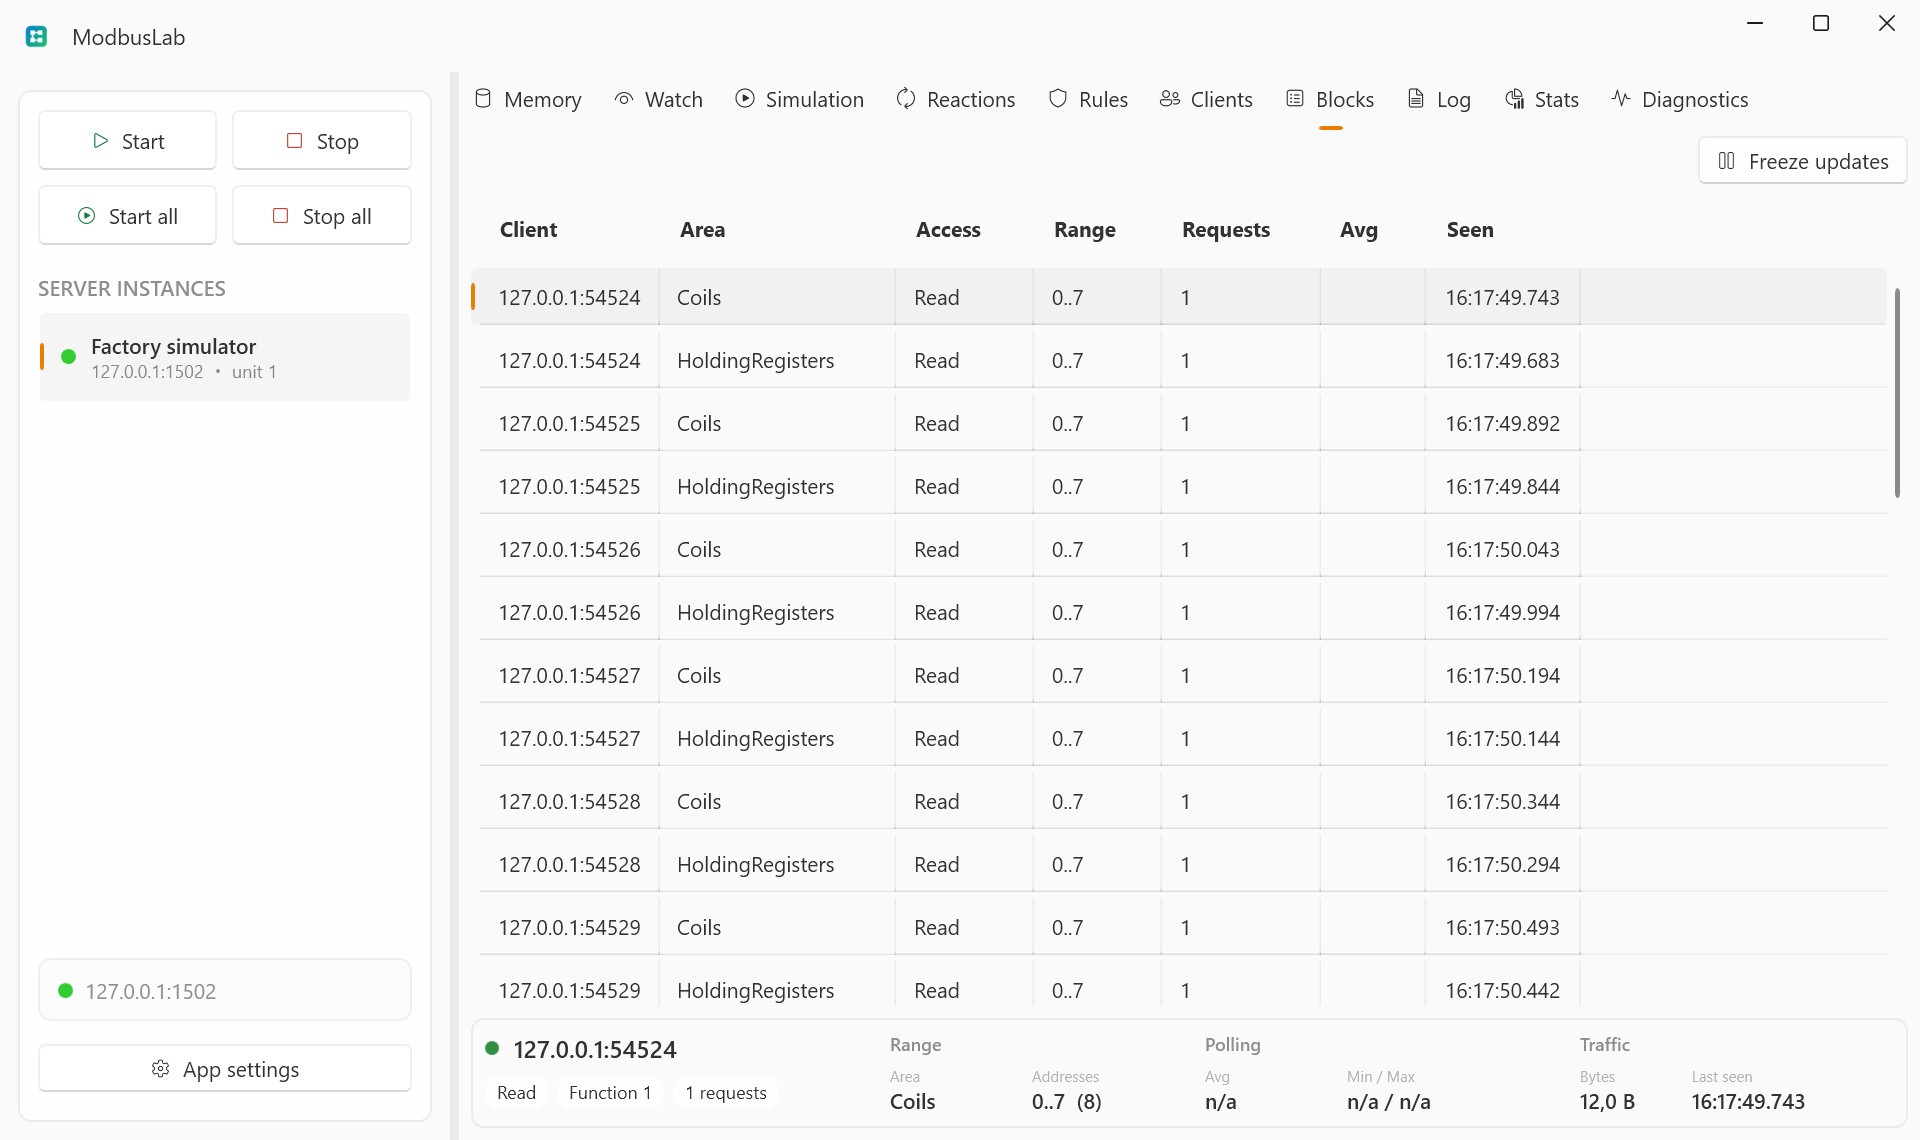
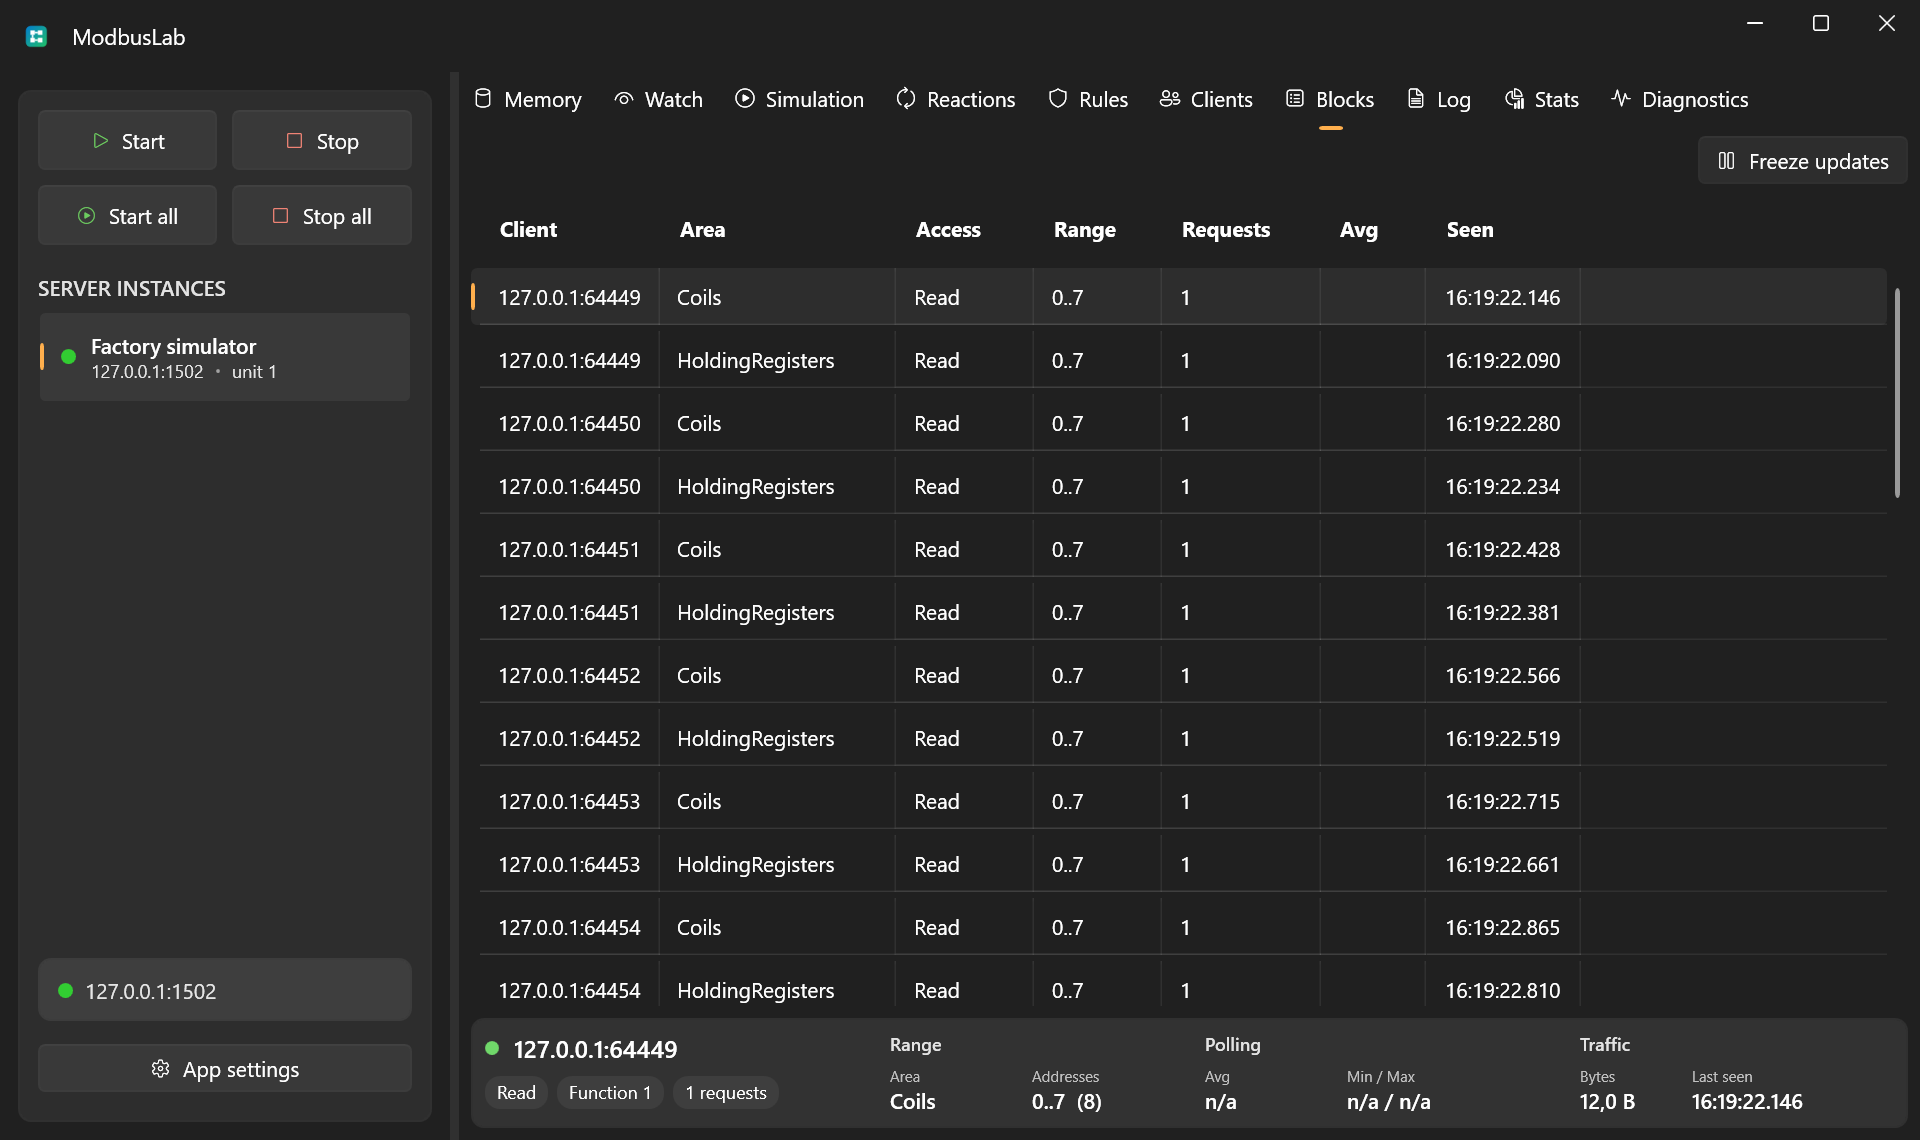
The Blocks view groups requests by:
- client;
- memory area;
- access type;
- function code;
- address range.
This makes polling behavior easier to read than raw logs. Rows use a stable range-first order so active traffic does not constantly reshuffle the table.
Log
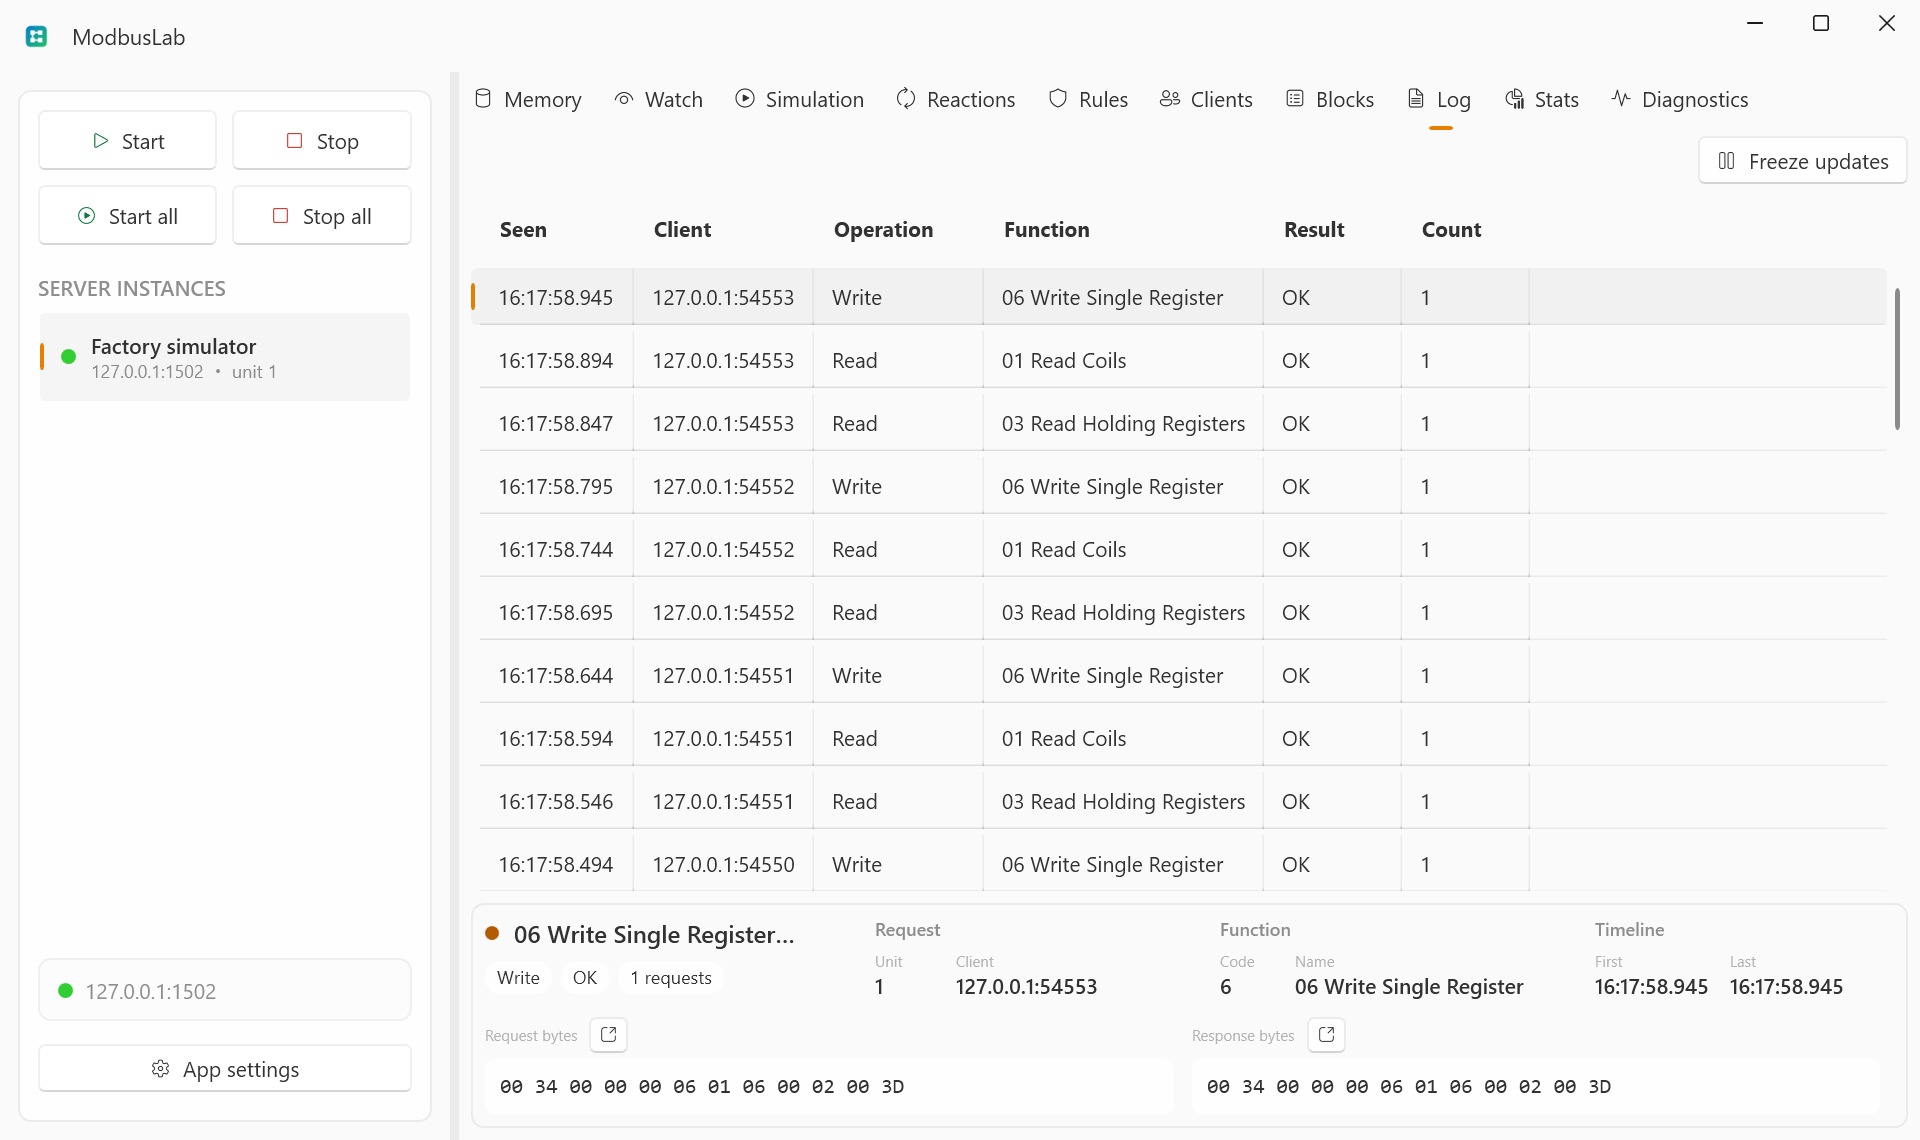
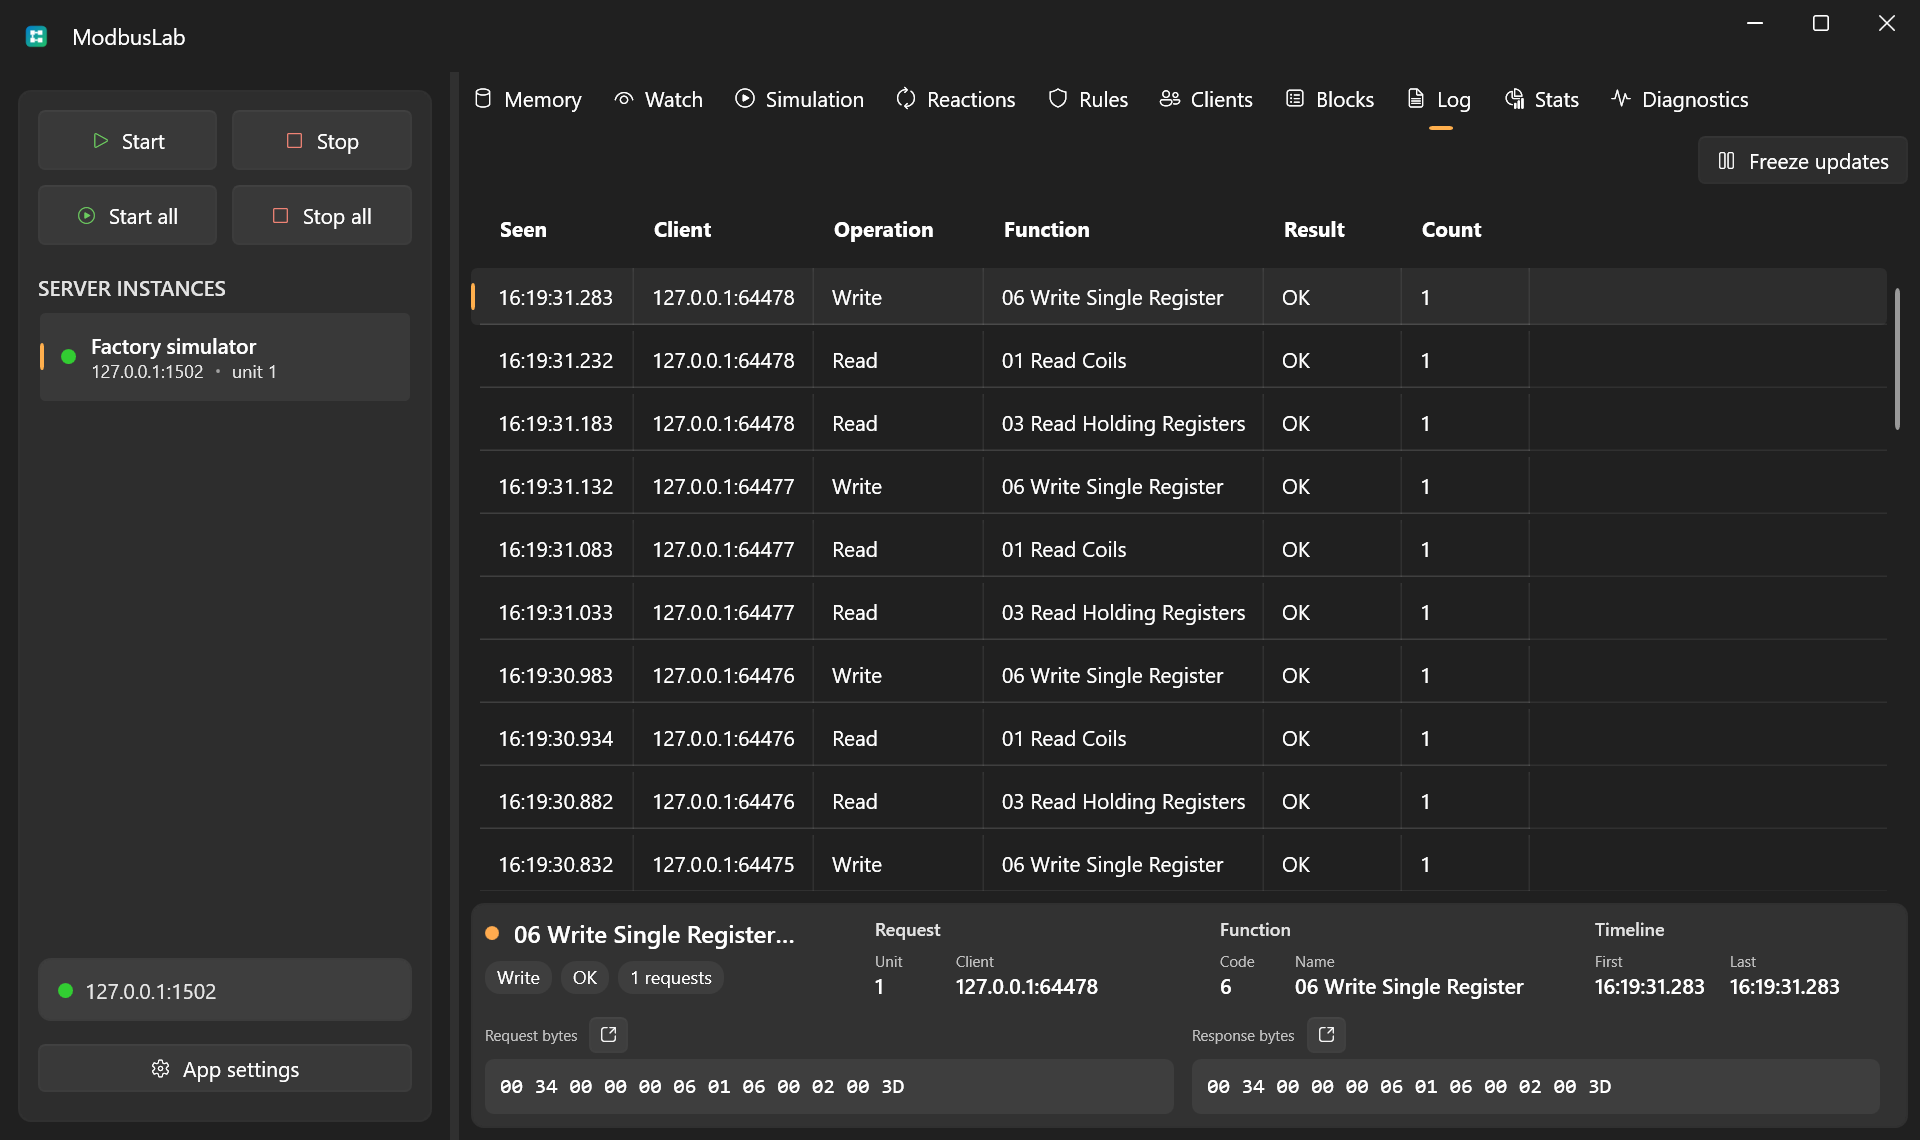
The Log view groups similar request/response entries so high-traffic sessions stay readable. Each row tracks count, timestamps, client, function, result, and request/response byte sizes.
Open request or response bytes from the footer to inspect the full hex payload.
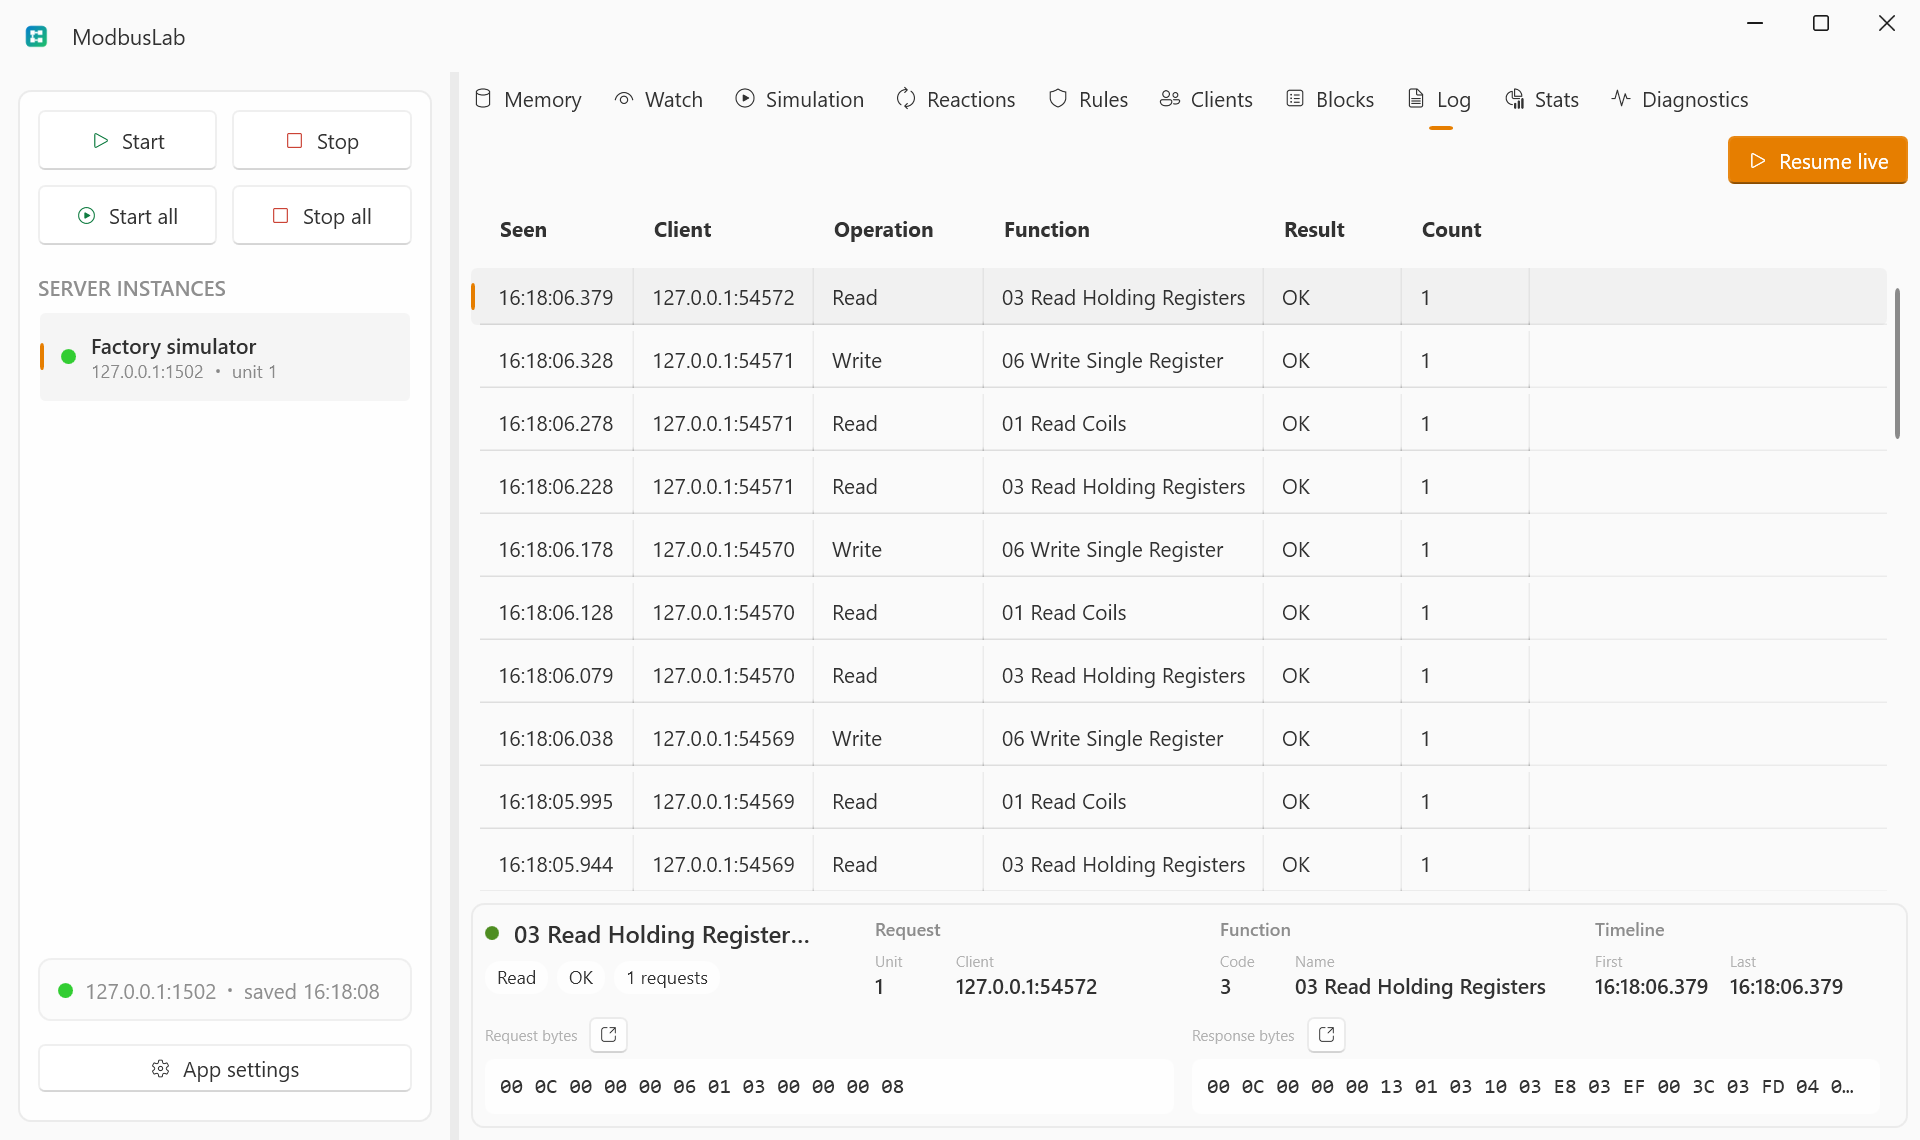
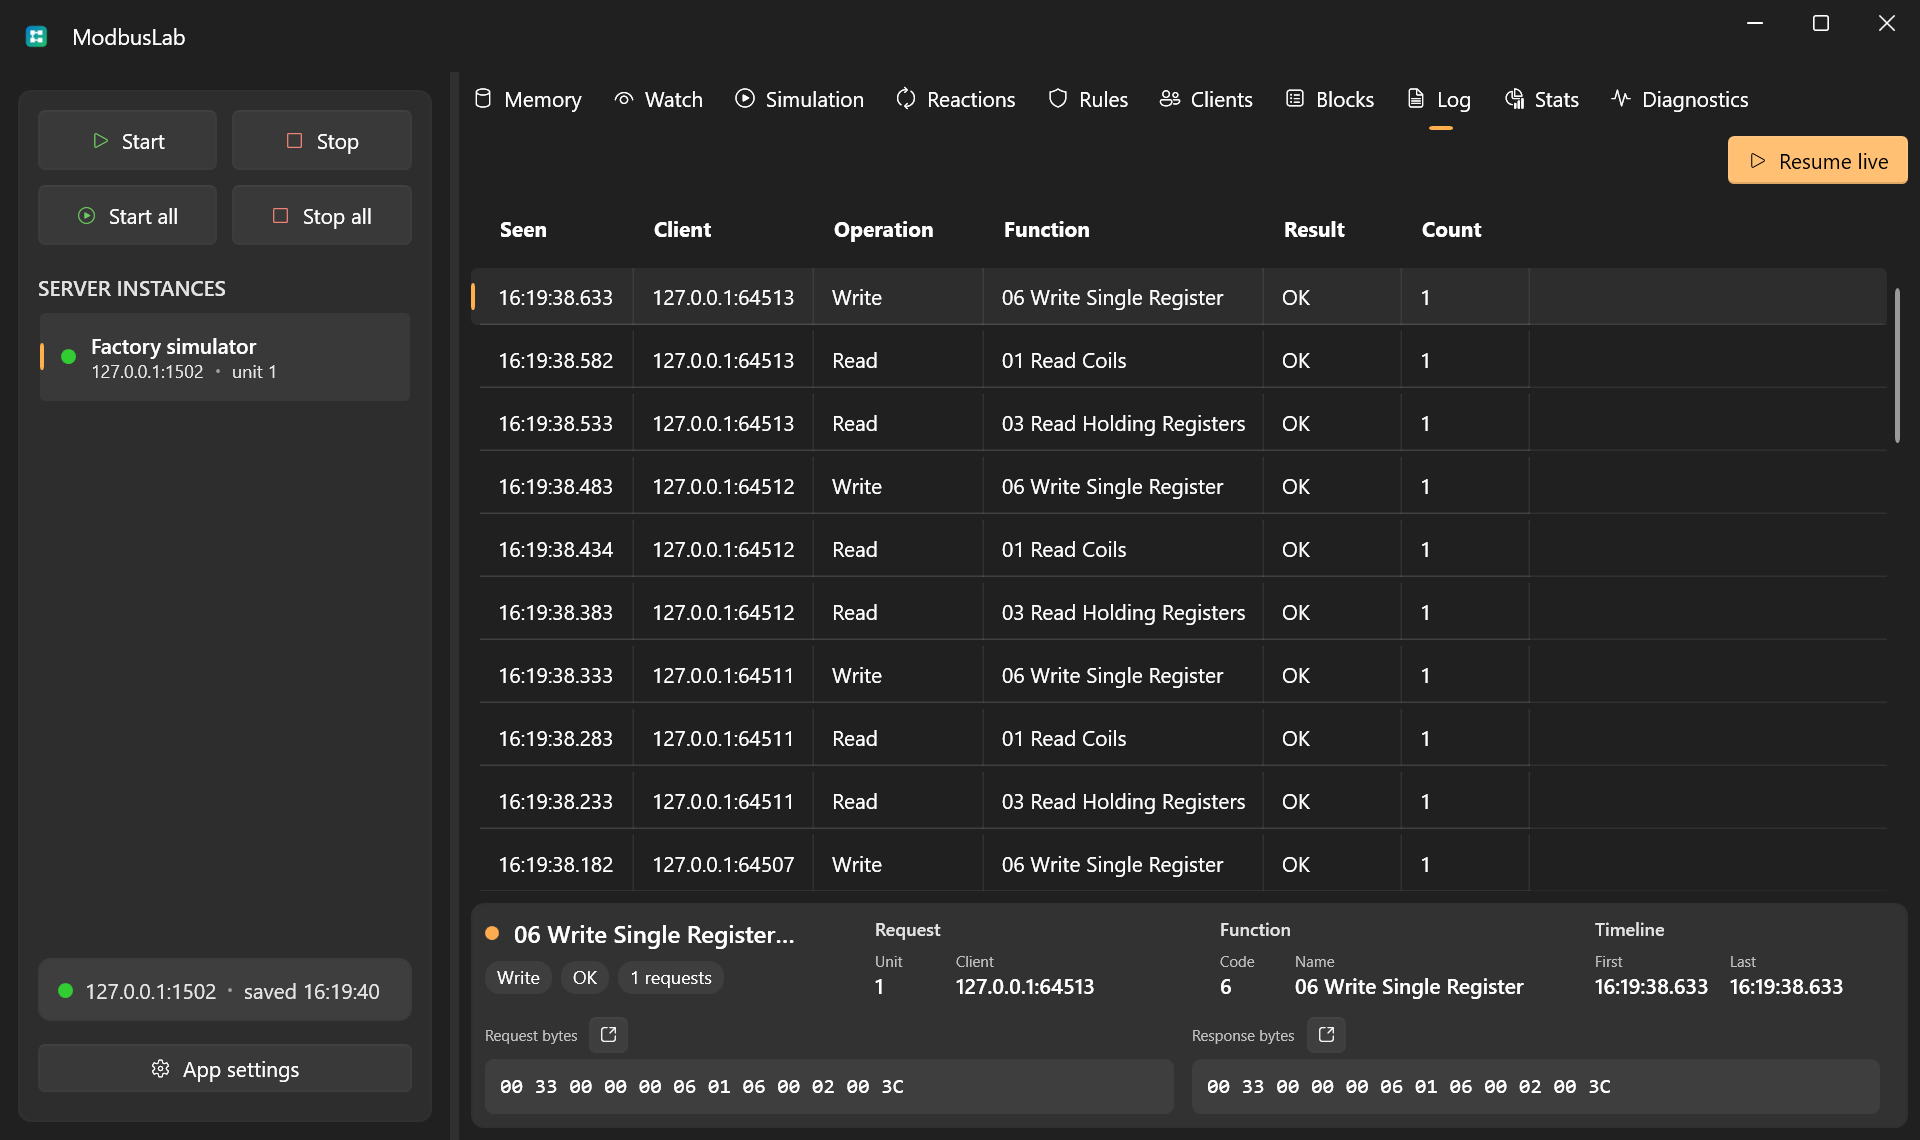
Use Freeze updates when traffic is moving too quickly to inspect a row. The server keeps collecting and aggregating logs, but the visible Log table, selected row, and footer stay fixed until you choose Resume live.
Stats
The Stats view summarizes server-level activity:
- total requests;
- requests per second;
- bytes in/out;
- clients and connections;
- errors and exceptions;
- latency;
- function distribution.
Diagnostics
Diagnostics provides runtime checks for the selected server configuration, traffic, health, automation, and self-test output.
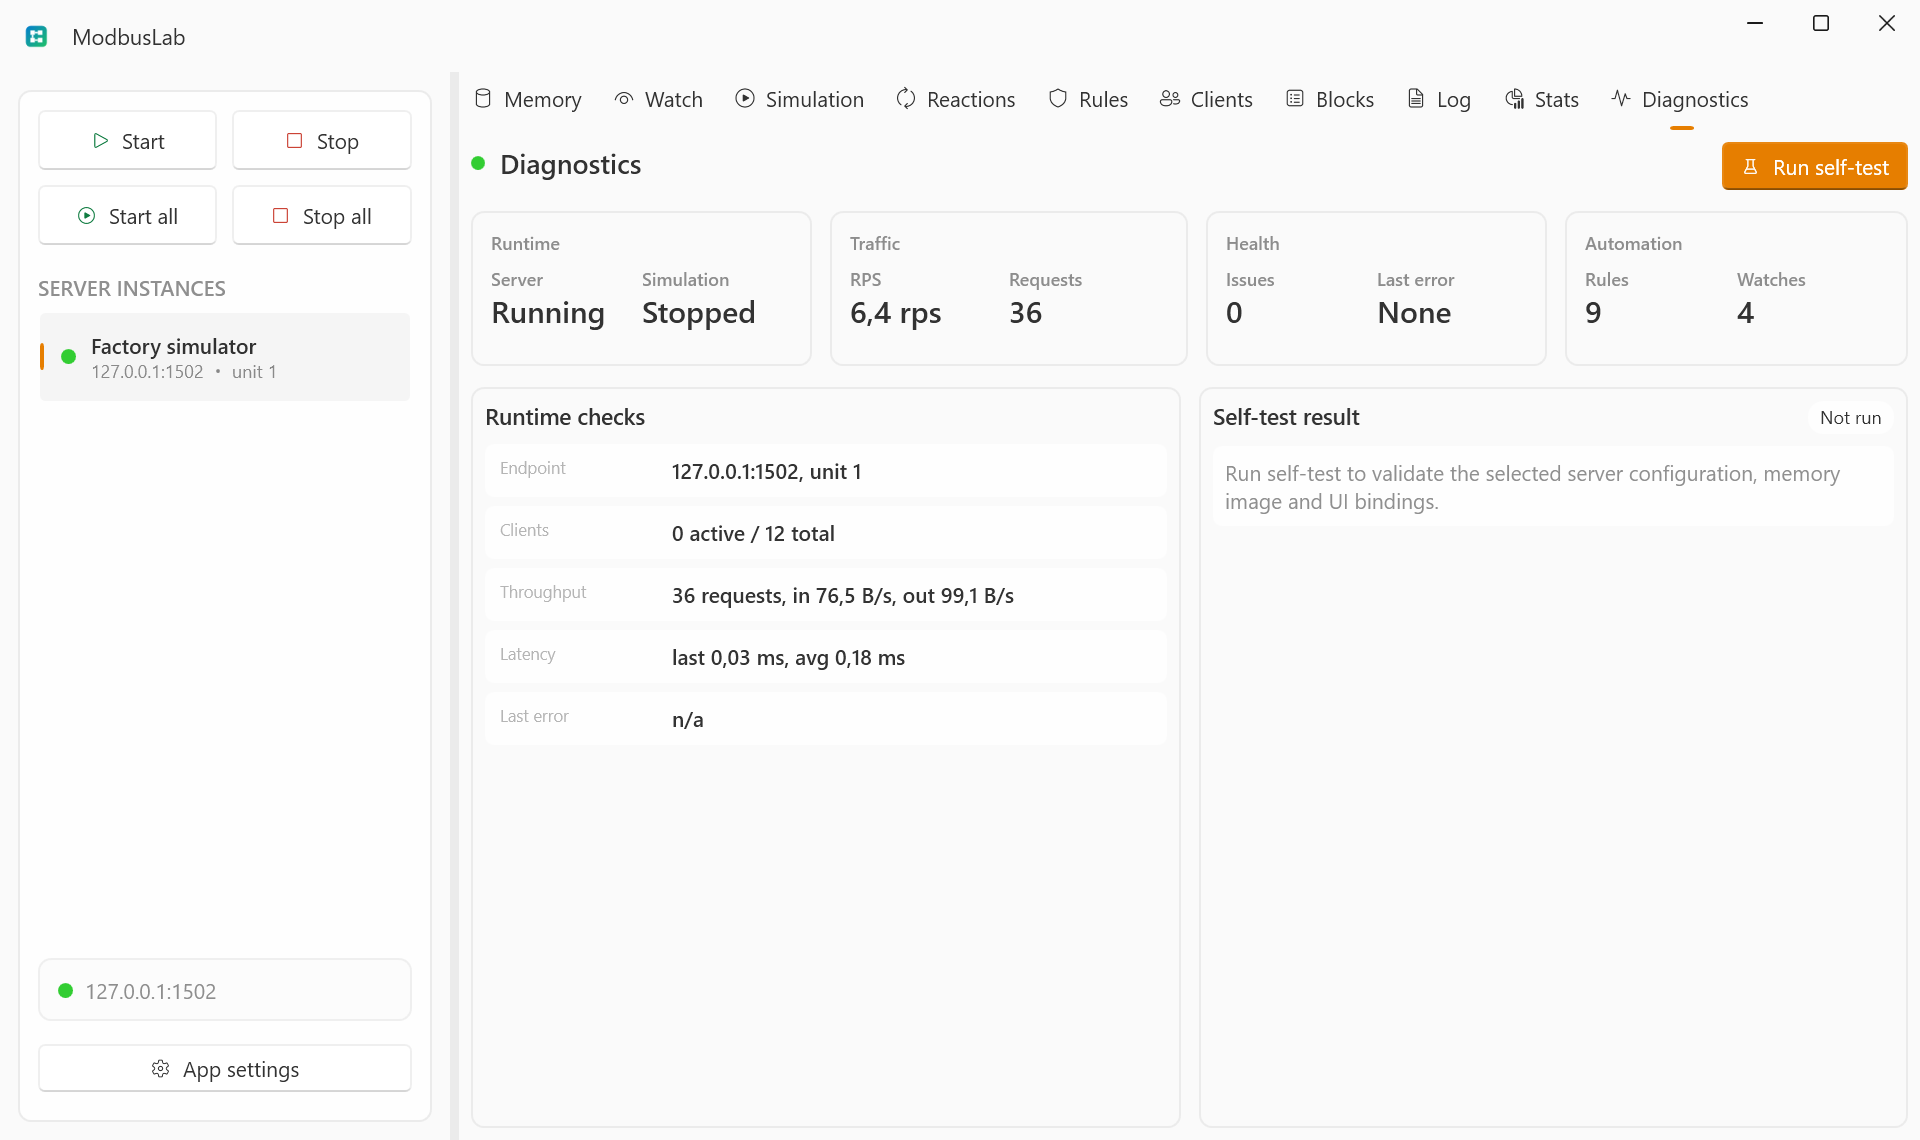
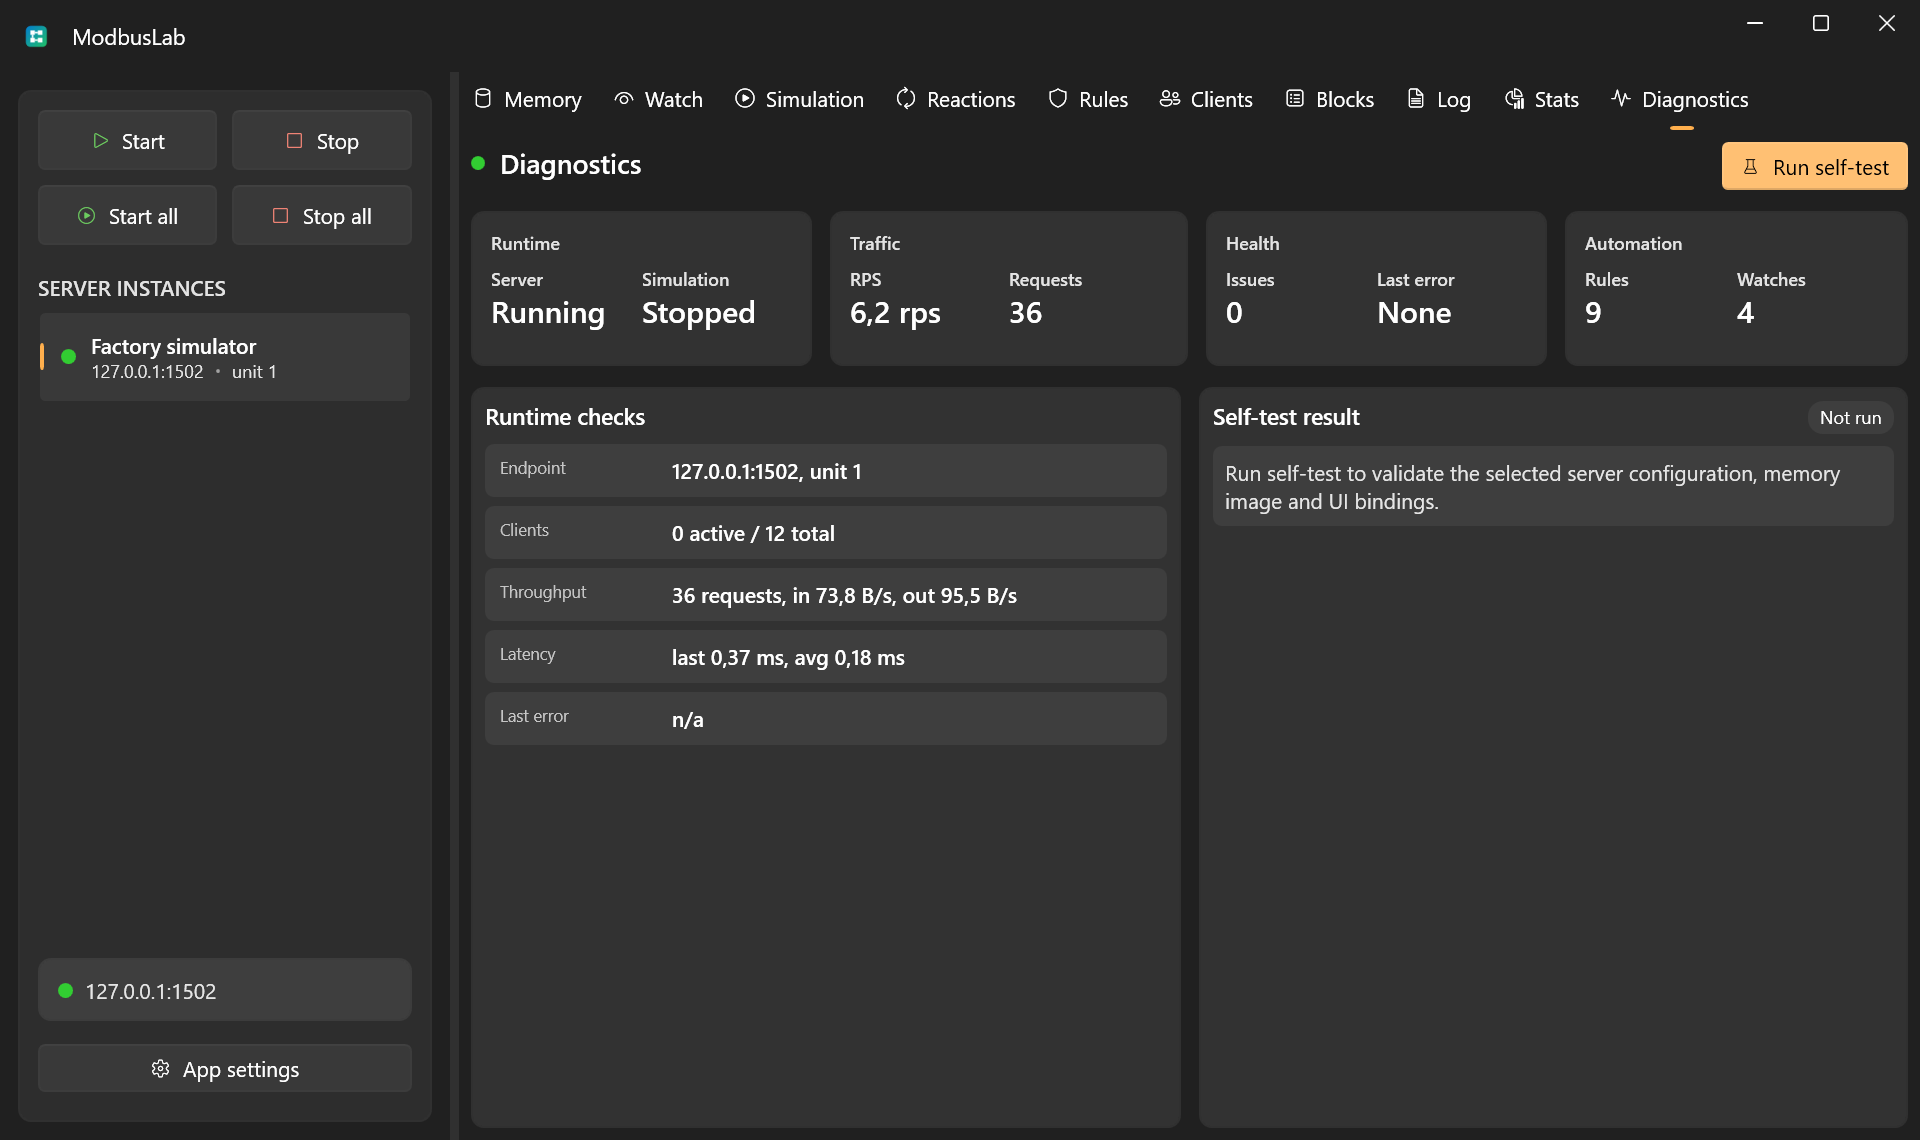
Table Controls
Clients, Blocks, Log, and Stats use the shared table interactions for row selection, sorting, column layout, row context menus, header context menus, and live update freezing.
See Table Controls for the common grid controls.